Knowledge Base / Glossary
Standard deviation
A measure of how far values in one numerical feature typically spread around their mean.
The standard deviation describes the spread of one numerical feature around its mean. A small standard deviation means the values stay relatively close to the mean. A larger one means they commonly sit farther away.
Standard deviation uses the same units as the feature. If root length is measured in millimeters, its standard deviation is also measured in millimeters.
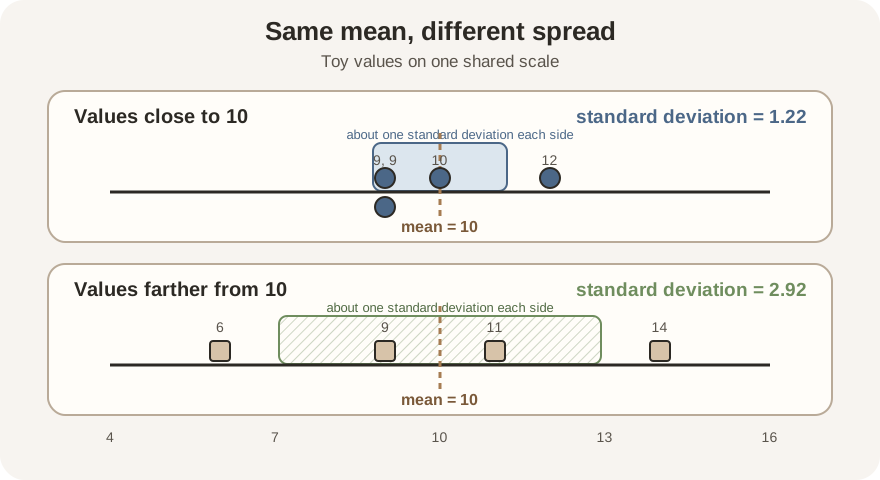
Scroll horizontally to inspect the diagram. The caption below provides a full text explanation.
The population calculation
Suppose one feature contains \(n\) values. Let \(x_i\) be value \(i\), let \(\mu\) be the mean of all \(n\) values, and let \(\sigma\) be their population standard deviation. Then
\[ \sigma = \sqrt{\frac{1}{n}\sum_{i=1}^{n}(x_i-\mu)^2}. \]Read the formula as a recipe:
- subtract the mean from each value;
- square each difference so negative and positive differences do not cancel;
- average the squared differences; and
- take the square root to return to the feature’s original units.
The average squared difference in step 3 is the variance. Standard deviation is its square root.
Worked example
For the values \(8,9,10,13\), the mean is \(10\). Their squared distances from the mean are \(4,1,0,9\), which sum to \(14\). Under the population convention,
\[ \sigma=\sqrt{14/4}=\sqrt{3.5}\approx1.87. \]This does not mean every value is exactly 1.87 units from the mean. It provides one summary of the whole set’s spread.
Population and sample conventions
The formula above divides by \(n\). It describes the values supplied to the
calculation and is the convention used by scikit-learn’s StandardScaler.
When data are treated as a sample used to estimate the spread of a larger
population, many programs instead divide by \(n-1\). For the four-value example,
that sample estimate is \(\sqrt{14/3}\approx2.16\).
Neither number is a typographical mistake. A report or code review should state the convention, especially when reproducing an exact result.
What standard deviation does not establish
- It is not the range between the minimum and maximum.
- It is not a confidence interval or a measure of uncertainty in the mean.
- It does not show whether the distribution is symmetric or has several clusters.
- It can be strongly affected by an outlier because distances are squared.
- Comparing raw standard deviations across features with different units can be misleading.
See also: standard scaling, Pearson correlation, and principal component analysis.