Knowledge Base / Glossary
Standard scaling
A feature-wise transformation that subtracts each column's mean and divides by that column's standard deviation.
Standard scaling, also called z-score standardization, puts numerical feature columns onto a common reference scale. It treats one feature column at a time: subtract that column’s mean, then divide by that column’s standard deviation.
After scaling under the same convention used to fit the transformation, each nonconstant training feature has mean zero and variance one. A standardized value says how many standard-deviation units an observation lies above or below that feature’s training mean.
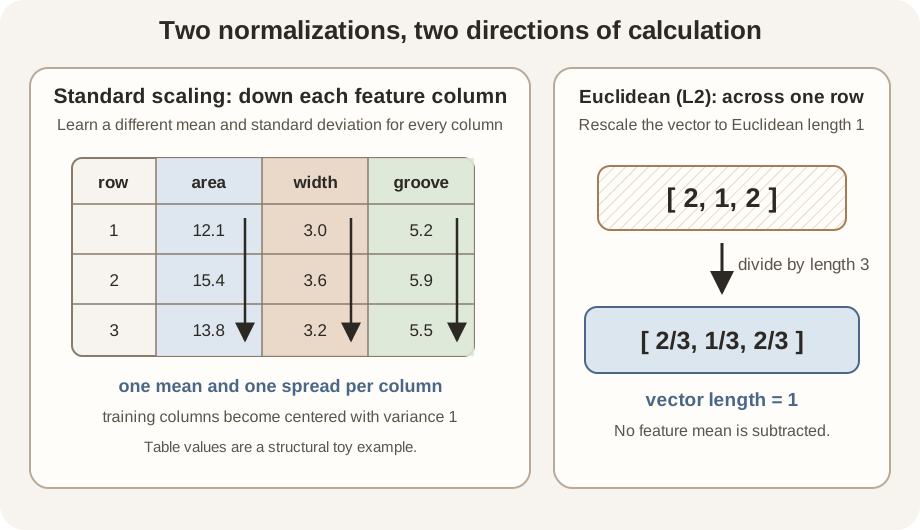
Scroll horizontally to inspect the diagram. The caption below provides a full text explanation.
The calculation, one cell at a time
Let \(x_{ij}\) be the observed value in row \(i\) and feature column \(j\). Let \(\mu_j\) and \(\sigma_j\) be the mean and standard deviation learned for column \(j\). The standardized value \(z_{ij}\) is
\[ z_{ij}=\frac{x_{ij}-\mu_j}{\sigma_j}. \]For a toy area measurement, suppose the observed value is \(15.7\), the fitted feature mean is \(14.2\), and the fitted standard deviation is \(2.1\). Then
\[ z=\frac{15.7-14.2}{2.1}\approx0.71. \]The value is about 0.71 standard deviations above the fitted mean. It is not a probability or a percentage. These numbers are illustrative rather than measurements from a named dataset.
If \(\sigma_j=0\), every training value in that feature is identical. Division by zero is undefined. A library must choose a handling rule, and the analyst should ask whether a constant feature belongs in the analysis at all.
Standard scaling is not L2 normalization
The two operations are easy to confuse because both involve division by a measure of size.
| Operation | Where it looks | What it learns or calculates | Typical result |
|---|---|---|---|
| Standard scaling | Down one feature column across many rows | That feature’s mean and standard deviation | Training column has mean 0 and variance 1 |
| L2 normalization | Across the coordinates within one row or vector | That vector’s Euclidean length | Each nonzero vector has length 1 |
Standard scaling changes a cell according to other observations in the same feature. L2 normalization changes a coordinate according to the other coordinates in the same vector. L2 normalization does not center feature columns or make their variances equal.
Why and when to use it
Methods such as principal component analysis are sensitive to numerical variance. Standard scaling can be reasonable when a one-standard-deviation change should have comparable influence across features measured in different units.
Scaling is a scientific choice, not a ritual. It can be inappropriate when absolute variance is meaningful, measurement noise differs greatly across features, or the inputs already have a scientifically meaningful normalization. A unit conversion error must be repaired before scaling; scaling does not make mixed units correct.
Evaluation boundary
For held-out prediction, learn each mean and standard deviation from the training rows only. Apply those stored values to both training and test rows. Learning them from all rows before splitting creates data leakage.
See also: standard deviation, L2 normalization, and data leakage.